Note
Click here to download the full example code
Validation of gPC approximation#
At some point you wish to know how well the gPC approximation fits to the original model function. Let us start by determining a gPC approximation with fixed basis of the Peaks function in the given interval:
import pygpc
from collections import OrderedDict

# define model
model = pygpc.testfunctions.Peaks()

# define problem
parameters = OrderedDict()
parameters["x1"] = pygpc.Beta(pdf_shape=[1, 1], pdf_limits=[1.2, 2])
parameters["x2"] = 1.25
parameters["x3"] = pygpc.Beta(pdf_shape=[1, 1], pdf_limits=[0, 0.6])
problem = pygpc.Problem(model, parameters)

# gPC options
options = dict()
options["method"] = "reg"
options["solver"] = "Moore-Penrose"
options["settings"] = None
options["order"] = [9, 9]
options["order_max"] = 9
options["interaction_order"] = 2
options["matrix_ratio"] = 2
options["error_type"] = "nrmsd"
options["n_samples_validation"] = 1e3
options["n_cpu"] = 0
options["fn_results"] = None
options["gradient_enhanced"] = True
options["gradient_calculation"] = "FD_1st2nd"
options["gradient_calculation_options"] = {"dx": 0.05, "distance_weight": -2}
options["backend"] = "omp"
options["grid"] = pygpc.Random
options["grid_options"] = None

# determine number of basis functions
n_coeffs = pygpc.get_num_coeffs_sparse(order_dim_max=options["order"],
                                       order_glob_max=options["order_max"],
                                       order_inter_max=options["interaction_order"],
                                       dim=problem.dim)
# generate grid
grid = pygpc.Random(parameters_random=problem.parameters_random,
                    n_grid=options["matrix_ratio"] * n_coeffs,
                    options={"seed": 1})

# initialize algorithm
algorithm = pygpc.Static(problem=problem, options=options, grid=grid)

# initialize gPC Session
session = pygpc.Session(algorithm=algorithm)

# run gPC algorithm
session, coeffs, results = session.run()
Out:
Using user-predefined grid with n_grid=110
Performing 110 simulations!

It/Sub-it: 9/2 Performing simulation 001 from 110 [                                        ] 0.9%
Total parallel function evaluation: 0.00033473968505859375 sec
Gradient evaluation: 0.0024042129516601562 sec
Determine gPC coefficients using 'Moore-Penrose' solver (gradient enhanced)...
-> relative nrmsd error = 1.5280199086409826e-07
Validate gPC vs original model function (2D-surface)#
After deriving the gPC approximation, you can compare our gPC with the original model in dependence of one or two parameters with the function pygpc.validate_gpc_plot(): sphinx_gallery_thumbnail_number = 2
pygpc.validate_gpc_plot(session=session,
                        coeffs=coeffs,
                        random_vars=["x1", "x3"],
                        n_grid=[51, 51],
                        output_idx=[0],
                        fn_out=None,
                        folder=None,
                        n_cpu=session.n_cpu)
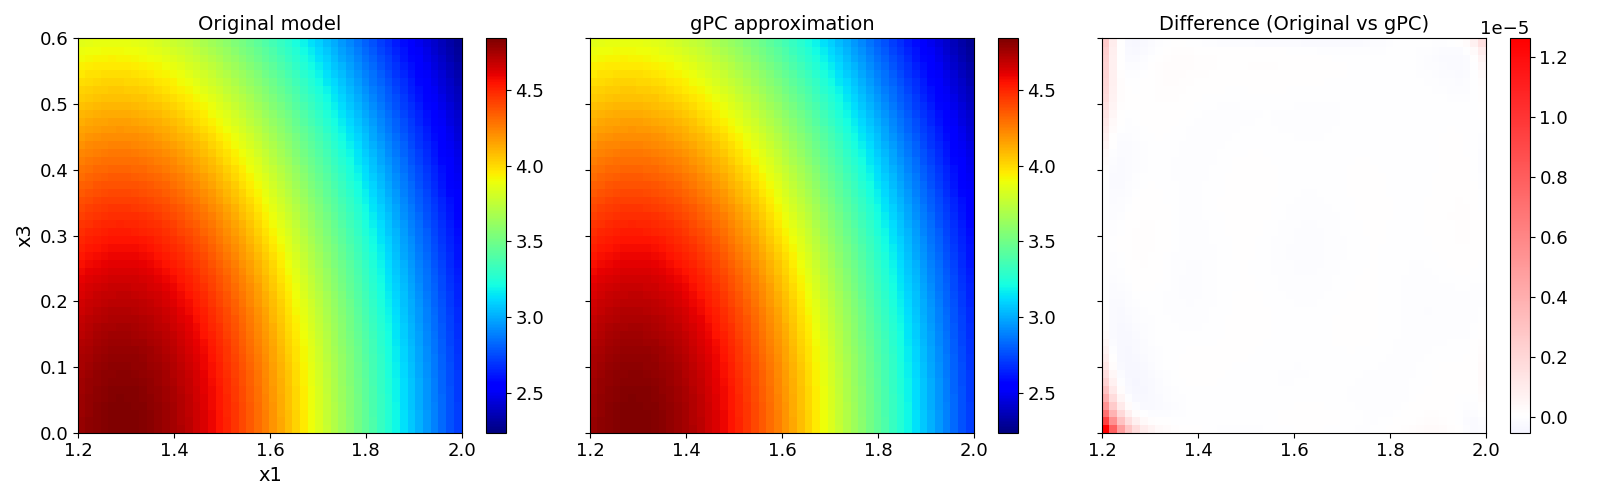
The random parameters for which we want to conduct the validation can be specified in the parameter random_vars. The remaining random parameters are set to their mean values. You can also specify the resolution of our validation in the parameter n_grid. Beware that this function calls the original model and may take some time to finish depending on the resolution and the computational cost of your model. If there exist multiple QOI, the index of the QOI has to be specified in the parameter output_idx. The results can be saved in an .hdf5 file specified with fn_out within a subfolder specified by folder. The parameter n_cpu specifies the kind of parallelization.
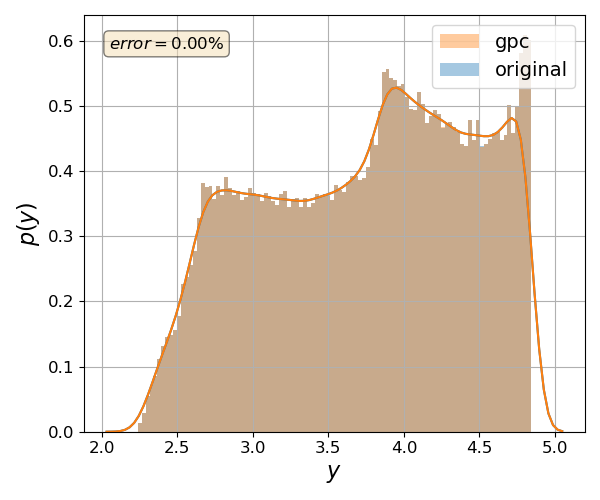
Validate gPC vs original model function (Monte Carlo)#
Another way to validate your gPC approximation is to compare the probability density function of a QOI between the gPC and the original. This can be done by calling the function pygpc.validate_gpc_mc():
nrmsd = pygpc.validate_gpc_mc(session=session,
                              coeffs=coeffs,
                              n_samples=int(1e5),
                              output_idx=None,
                              fn_out=None,
                              folder=None,
                              plot=True,
                              n_cpu=session.n_cpu)

print("> Maximum NRMSD (gpc vs original): {:.2}%".format(max(nrmsd)))
Out:
> Maximum NRMSD (gpc vs original): 1.3e-07%
The parameter n_samples specifies the number of random samples drawn. Beware that this function calls the original model and may take some time to finish. If you want to conduct the comparison for a specific QOI, you can define it with the parameter output_idx. Similar to the previous function, the results can be saved into an .hdf5 file specified with the parameter fn_out within a subfolder folder. The plots can be supressed by setting the plot to False.
# On Windows subprocesses will import (i.e. execute) the main module at start.
# You need to insert an if __name__ == '__main__': guard in the main module to avoid
# creating subprocesses recursively.
#
# if __name__ == '__main__':
#     main()
Total running time of the script: ( 0 minutes 2.719 seconds)